
Welcome back to our three-part series on using product segmentation to increase returns. In the first post of this series, we covered the basics – why we use segmentation and which pricing methods work best for different parts categories. Let’s pick it up where we left off, looking at opportunities to differentiate.
How can we define segments?
In many cases, the ability to charge a premium on products is driven by whether an item is captive or commercial, and it’s usually clear how that group should be priced. Another way to look at this is whether you make the product or buy it.
If you make the product – if you have drawings available – then it’s likely that the item is proprietary and you can assume there’s some level of captivity. If you buy the part from a supplier, you have to ask whether they are only supplying it to you, the manufacturer, or to your end customer as well. Supplier know-how can tell you a lot – some suppliers might be very protective over your parts while others might offer them to anyone. This type of understanding provides further insight into specific commercial conditions that can impact pricing.
There are a number of other key factors you can also look at to determine the level of competitive pressure on an item.
If a purchased part has a unique design for your products, it’s probably less commercial. If you can find competitor data for a part, including the price, it’s very likely a commercial item. Sales volume is a good indicator of the risk of competition – suppliers are only likely to copy parts with the highest sales. Market share also helps to define the competitive situation. And where an item is in its lifecycle can give you an idea – in the early stages, you might be the only one offering it to the market. This also applies when a part is obsolete. And then there are various strategies you can apply along that product lifecycle.
For example, warranty items are treated differently based on how customers or dealers are reimbursed. Ranking items on a complexity scale can help you determine how much competition there is in the market. And repair type and production methods can also be drivers for segmentation. It all depends on how much data you have to work with.
Building a segmentation structure
We’ve identified three main tracks that OEMs follow when creating a structure for segmentation: product hierarchy, conditional matching, and segmentation calculation. Which one will work best for your organization depends on your mindset and the market you’re in – product hierarchy is the go-to method in Europe, while segmentation calculation tends to be more popular in the US. No single model is a one-size-fits all. In fact, we recommend using a combination of the three to build your structure.
Product hierarchy
This approach is technically driven. For example, say you have air filters that are commercial but relatively unique to your machines. In this case, you’d want to use a value-based pricing approach with volume and filter paper quality as the drivers. Under the “filters” category, you may also have oil and water filters that are sold by multiple competitors. For these items, you’d want to use a competitor-based pricing approach with competitor list prices as the drivers. If you have a high number of filter categories, each driven by different competitors, it may make more sense to take a commercially-driven approach rather than sticking with this engineering-based structure.
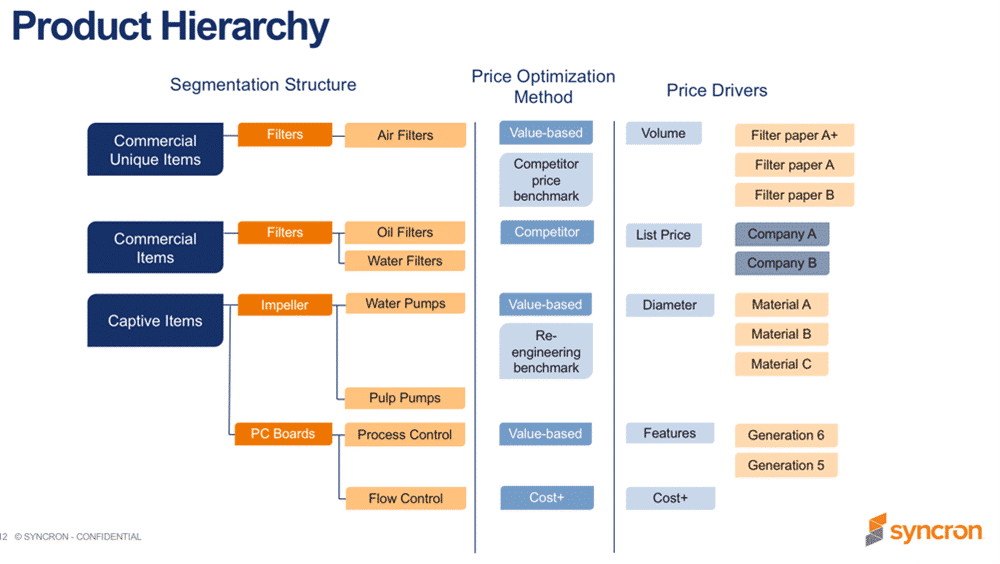
The pros of this method are that’s it a prerequisite for an apples-to-apples, value-based pricing approach, and that structures built by engineering can be reused. The cons are that it doesn’t capture different commercial conditions within product groups – for example, you don’t know if an item is captive or commercial. And it’s not suitable when you have a lot of segmentation drivers. In some cases, you may end up with 500 or 1,000 different segments, which becomes very cumbersome to manage.
Conditional matching
This approach focuses on suppliers and it starts by identify commercial items. Then you can segment items by which suppliers sell them and, if they are transparent, set a competitive benchmark using their list prices. If other suppliers are selling the same parts to your end customers, technical differentiation doesn’t matter – you need to price accordingly. You can also use this structure to price based on other priorities that define a part as highly commercial, such as where you’re buying it from and the type, complexity, and sales volume. The focus is on commercial considerations rather than product hierarchies.
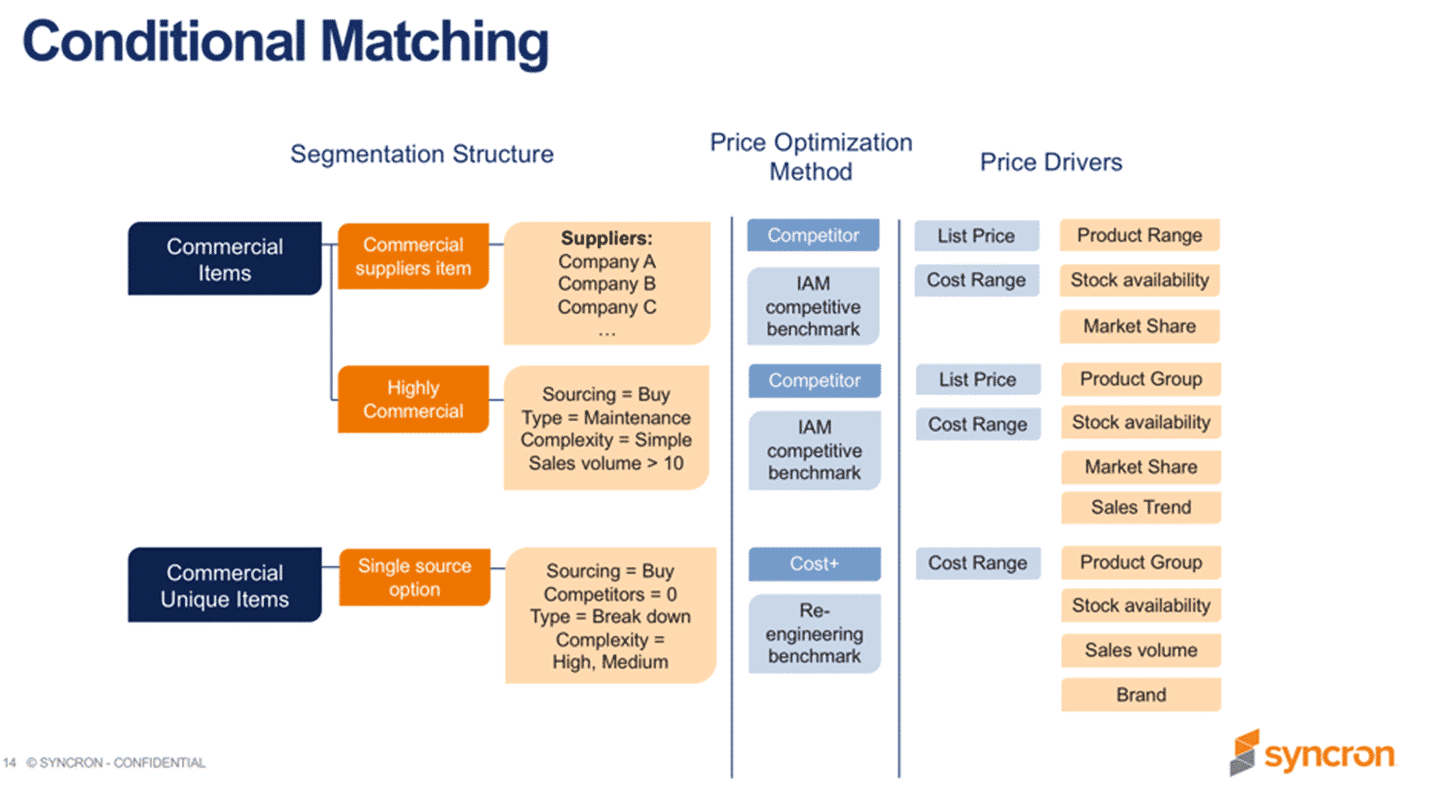
The advantages of conditional matching are that it captures similar commercial conditions across products and enables differentiation for non-product-related segmentation. If something changes, you can automatically re-segment based on dynamic variables such sales volume or supplier. And this structure aggregates smaller product groups into larger product groups for easy administration. The cons are that it can generate inconsistencies for similar products and requires more data than an engineering-based structure.
Segmentation calculation
This structure works best when using the data that’s available to you to create a scoring model. You can include factors such as make or buy, number of competitors, product group, sales volume, and suppliers. You can then set rules for the score – for example, items with a lower score are captive items – so you know you can have higher margins on those parts. Products with a mid-range score may be semi-captive, so you can use that score to drive margins and benchmark prices. And then the higher-scoring items you know are commercial, and should be priced according to the market share, competitive list price, etc. This is a quick way to understand whether or not items are captive and adds value by saving you time on pricing the bulk of your items.
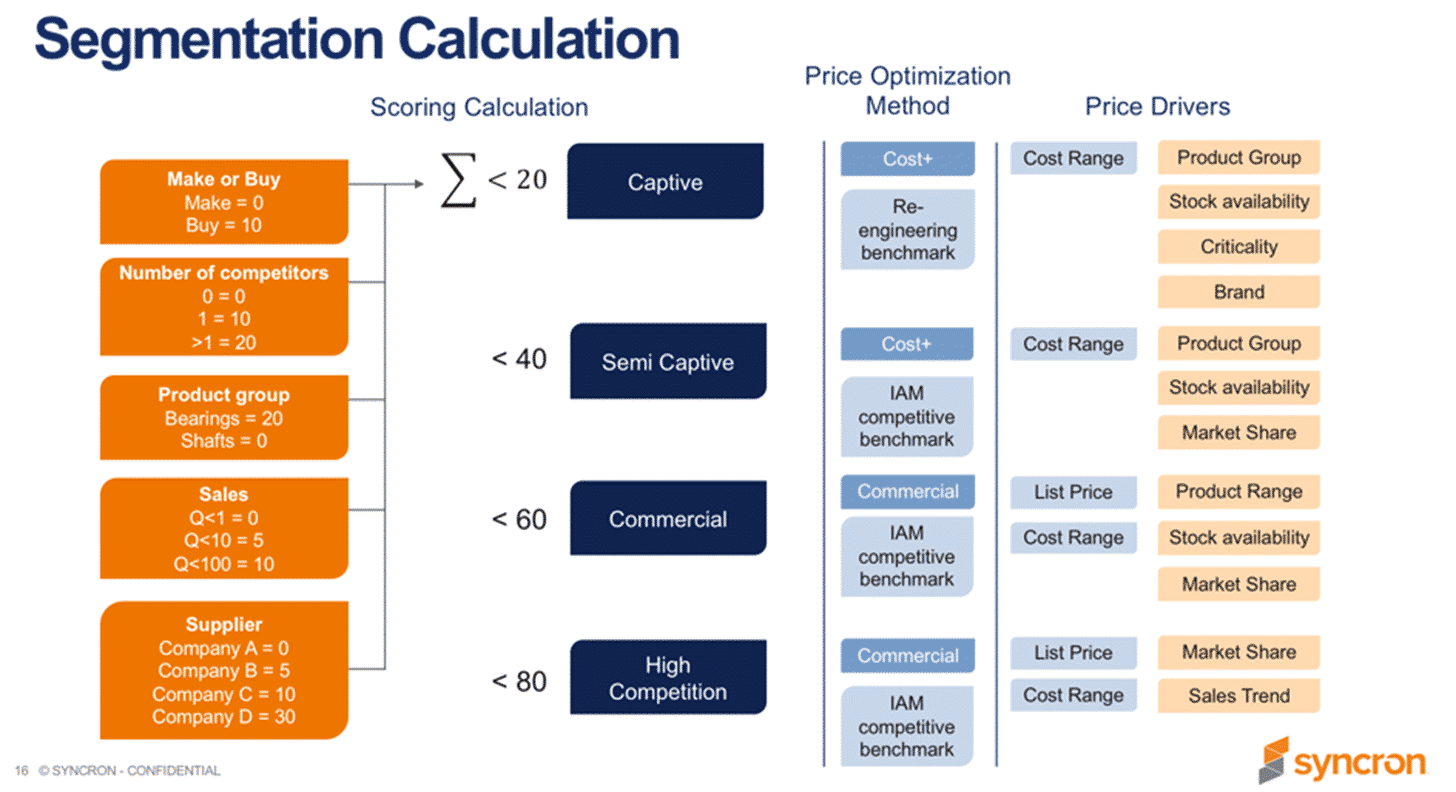
The advantage of this structure is that it makes price setting easy using a cost-plus approach. It is also more forgiving of missing or inaccurate data – you’ll still get a rough idea of how to price even if your data isn’t perfect. The disadvantages are that it requires a fixed set of variables across all the items in your scope and offers limited analytical capabilities for product-focused business development.
See you back here again for Part 3, where we’ll wrap up this series by looking at a combined structure approach, how to find the right level of detail, and local market considerations. If you’re ready to see what Syncron Price™ can do for your pricing strategy, contact us today.