
A leader in service parts planning
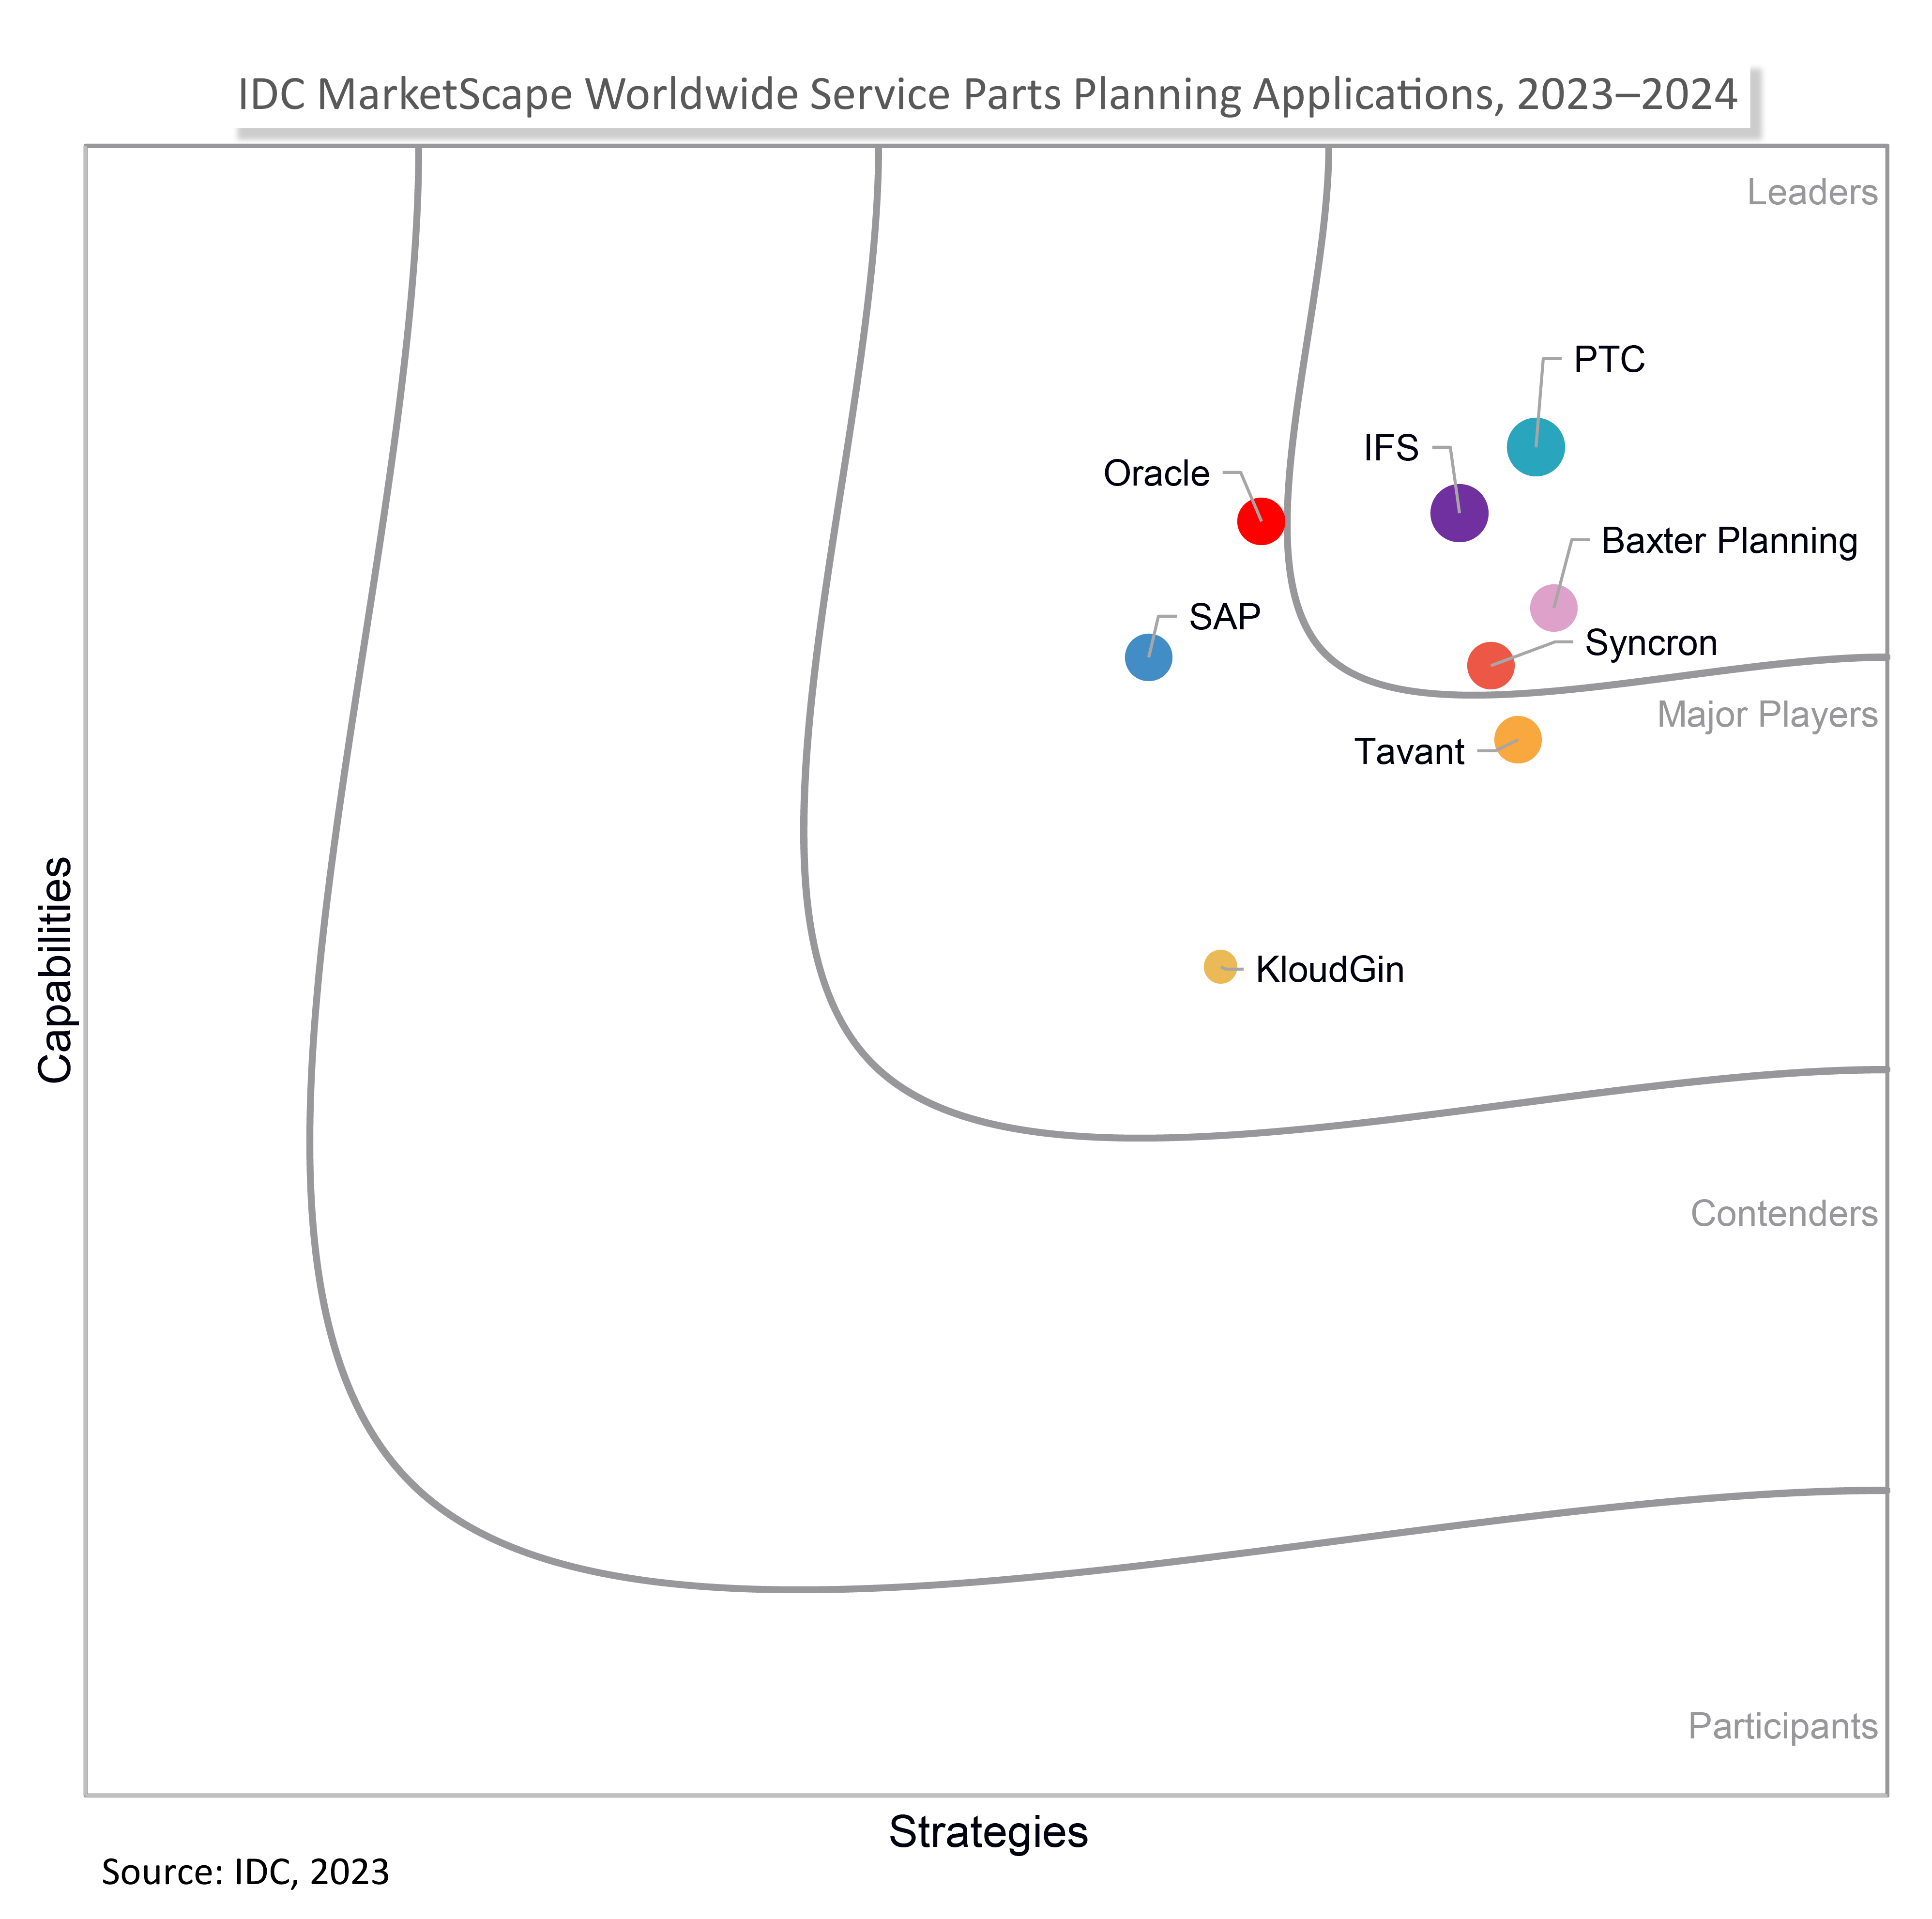
Syncron has been named a Leader in the IDC MarketScape: Worldwide Manufacturing Service Parts Planning Applications 2023–2024 Vendor Assessment*. We believe this recognition underscores Syncron’s innovative approach to service parts planning, demonstrating a commitment to advancing the aftermarket service industry.
The report evaluates capabilities and business strategies of eight prominent technology vendors in service parts planning and aftermarket service. IDC derives overall positions from detailed surveys, vendor interviews, publicly available information, and user experiences for a reliable and consistent evaluation.
A niche focus on aftermarket service
According to the report, “Syncron’s cloud-based offering is built to be rapidly deployed and help service teams improve service parts planning processes with a fast time to value. Syncron helps customers achieve an average ROI from 3 months to 1 year for its service parts planning offering.”
Domain knowledge in manufacturing and complex industries
According to the report, “Syncron primarily supports large manufacturing companies with complex service parts planning needs. Syncron invests more than 20% of its revenue into R&D specific to service parts planning and has shown a track record of innovation.”
* IDC MarketScape: Worldwide Manufacturing Service Parts Planning Applications 2023–2024 Vendor Assessment, Aly Pinder, December 2023, IDC #US49989323
SOURCE: IDC MarketScape: Worldwide Manufacturing Service Parts Planning Applications 2023–2024 Vendor Assessment, Aly Pinder, December 2023, IDC #US49989323
IDC MarketScape vendor analysis model is designed to provide an overview of the competitive fitness of ICT suppliers in a given market. The research methodology utilizes a rigorous scoring methodology based on both qualitative and quantitative criteria that results in a single graphical illustration of each vendor’s position within a given market. The Capabilities score measures vendor product, go-to-market and business execution in the short-term. The Strategy score measures alignment of vendor strategies with customer requirements in a 3-5-year timeframe. Vendor market share is represented by the size of the icons.
We believe being named a Leader by the IDC MarketScape is a testament to our team’s dedication and the innovative spirit that drives Syncron. Our solutions are not just about managing service parts—they are about empowering businesses to excel in a complex and dynamic market. We are proud to be at the forefront of this transformation.